Question 8
All functions are causal (zero for ). Use the one-sided Laplace transform and . Write for and for . Values at isolated endpoints do not affect an ordinary integral.
Suppose an ordinary continuous input produces . No impulses and no nonzero initial state are allowed. Consider the desired output and the perturbed outputs
Tasks
Characterize all continuously differentiable outputs obtainable from such inputs, and prove uniqueness of the recovered input.
Recover the input for . Decide whether the target is obtainable, explaining why differentiating alone can give a misleading answer.
Recover the input for and bound its output error in the uniform norm on . Compute the input error at zero.
Choose a sequence for which the output errors tend uniformly to zero but the input errors grow without bound. Interpret what this means for reconstruction from approximate measurements.
Show solutionHide solution
Question 8 – Solution
Strategy. Inversion differentiates the output. Check the initial-value restriction before using that derivative formula.
Step 1: Derive and prove the inverse rule. Differentiation under the integral gives , . Therefore a target is obtainable exactly when it starts at zero, and its only possible continuous input is . Conversely, for this input, the target and the convolution solve the same IVP , . Uniqueness proves they agree.
Step 2: Check two targets. For , , so the input is . The target is impossible because its value at zero is . Although its derivative plus itself is zero, a zero input with zero initial state produces the zero output. Differentiation discards the missing initial condition.
Step 3: Differentiate the perturbation. The two exponential-derivative terms cancel, leaving All these inputs are continuous, and the target outputs vanish at zero. The uniform output error is at most because . The input error at zero is ; in fact this is its uniform norm since .
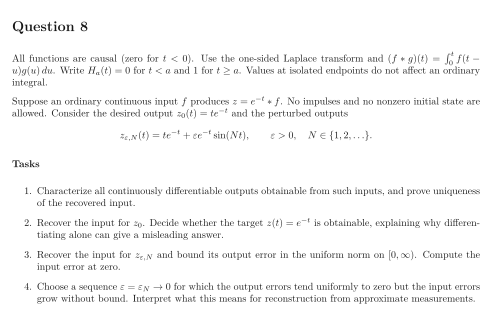
Step 4: Exhibit the instability. Take . Then Thus the inverse is not continuous in the uniform output norm, even on smooth attainable outputs. Small high-frequency measurement errors can produce large reconstruction errors. The figure uses , ; each panel compares its own exact and perturbed functions.
See the diagram in the original worksheet below.