Tangent Lines and Rates of Change — Question 3

PDF ↗

Question 3

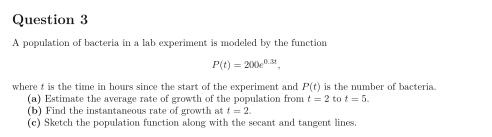
A population of bacteria in a lab experiment is modeled by the function P(t)=200e0.3t,P(t) = 200e^{0.3t}, where tt is the time in hours since the start of the experiment and P(t)P(t) is the number of bacteria.

(a) Estimate the average rate of growth of the population from t=2t = 2 to t=5t = 5.

(b) Find the instantaneous rate of growth at t=2t = 2.

(c) Sketch the population function along with the secant and tangent lines.

Original worksheet page 1: question and worked solution for 2-1-003
Show solutionHide solution

Question 3 - Solution

We are given: P(t)=200e0.3tP(t) = 200e^{0.3t}

(a) Average rate of change on [2,5][2, 5]: P(2)=200e0.6≈200(1.8221)=364.42P(2) = 200e^{0.6} \approx 200(1.8221) = 364.42 P(5)=200e1.5≈200(4.4817)=896.34P(5) = 200e^{1.5} \approx 200(4.4817) = 896.34 Average rate=896.34−364.425−2≈531.923≈177.31 bacteria/hr\text{Average rate} = \frac{896.34 - 364.42}{5 - 2} \approx \frac{531.92}{3} \approx 177.31 \text{ bacteria/hr}

(b) Instantaneous rate at t=2t = 2: P′(t)=200⋅0.3e0.3t=60e0.3tP'(t) = 200 \cdot 0.3e^{0.3t} = 60e^{0.3t} P′(2)=60e0.6≈60(1.8221)=109.33 bacteria/hrP'(2) = 60e^{0.6} \approx 60(1.8221) = 109.33 \text{ bacteria/hr}

(c) Interpretation: The population grows faster over the longer interval than it does exactly at t=2t = 2, illustrating exponential acceleration.

See the diagram in the original worksheet below.

Original worksheet page 2: question and worked solution for 2-1-003

Original worksheet layout. Use Enlarge or open the PDF for a closer view.