Common Graphs — Question 7

PDF ↗

Question 7

Sketch the graph of the function: f(x)=1x2+1f(x) = \frac{1}{x^2 + 1}

Instructions: Identify the domain, range, intercepts, end behavior, and any symmetry of the function. Then sketch the graph.
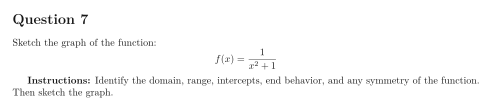
Original worksheet page 1: question and worked solution for 1-10-007
Show solutionHide solution

Question 7 - Solution

We are given: f(x)=1x2+1f(x) = \frac{1}{x^2 + 1}

Step 1: Domain

Since x2+1>0x^2 + 1 > 0 for all real xx, the domain is: (−∞,∞)\boxed{(-\infty, \infty)}

Step 2: Y-intercept

Set x=0x = 0: f(0)=102+1=1f(0) = \frac{1}{0^2 + 1} = 1

Step 3: X-intercepts

Set f(x)=0f(x) = 0: 1x2+1=0⇒no solution\frac{1}{x^2 + 1} = 0 \Rightarrow \text{no solution} So, no x-intercepts.

Step 4: Range

Since the denominator is always ≥1\geq 1, the maximum occurs at x=0x = 0, and the function decreases on both sides. Therefore: Range: (0,1]\boxed{\text{Range: } (0, 1]}

Step 5: Symmetry

f(−x)=1(−x)2+1=1x2+1=f(x)f(-x) = \frac{1}{(-x)^2 + 1} = \frac{1}{x^2 + 1} = f(x) So the function is even, symmetric about the y-axis.

Step 6: End Behavior

As x→±∞x \to \pm \infty, f(x)→0f(x) \to 0

See the diagram in the original worksheet below.

Original worksheet page 2: question and worked solution for 1-10-007

Original worksheet layout. Use Enlarge or open the PDF for a closer view.